plotSubtrees - Plots subtree statistics for multiple trees
Description
plotSubtree plots distributions of normalized subtree statistics for a
set of lineage trees, broken down by annotation value.
Usage
plotSubtrees(
graphs,
field,
stat,
root = "Germline",
exclude = c("Germline", NA),
colors = NULL,
main_title = "Subtrees",
legend_title = "Annotation",
style = c("box", "violin"),
silent = FALSE,
...
)
Arguments
- graphs
- list of igraph objects containing annotated lineage trees.
- field
- string defining the annotation field.
- stat
- string defining the subtree statistic to plot. One of:
outdegree: distribution of normalized node outdegrees.size: distribution of normalized subtree sizes.depth: distribution of subtree depths.pathlength: distribution of maximum pathlength beneath nodes.
- root
- name of the root (germline) node.
- exclude
- vector of strings defining
fieldvalues to exclude from plotting. - colors
- named vector of colors for values in
field, with names defining annotation namesfieldcolumn and values being colors. Also controls the order in which values appear on the plot. IfNULLalphabetical ordering and a default color palette will be used. - main_title
- string specifying the plot title.
- legend_title
- string specifying the legend title.
- style
- string specifying the style of plot to draw. One of:
"histogram": histogram of the annotation count distribution with a red dotted line denoting the observed value."cdf": cumulative distribution function of annotation counts with a red dotted line denoting the observed value and a blue dotted line indicating the p-value.
- silent
- if
TRUEdo not draw the plot and just return the ggplot2 object; ifFALSEdraw the plot. - …
- additional arguments to pass to ggplot2::theme.
Value
A ggplot object defining the plot.
Examples
# Define example tree set
graphs <- ExampleTrees[1:10]
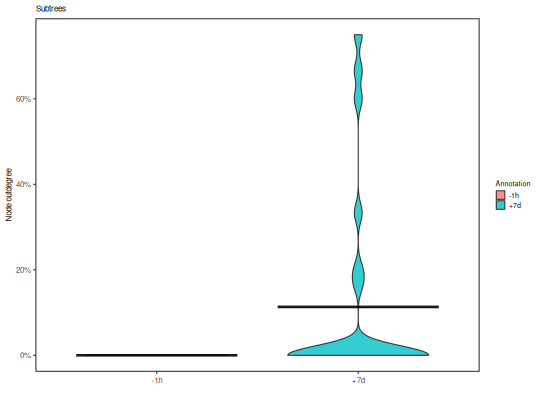
# Violin plots of node outdegree by sample
plotSubtrees(graphs, "sample_id", "out", style="v")
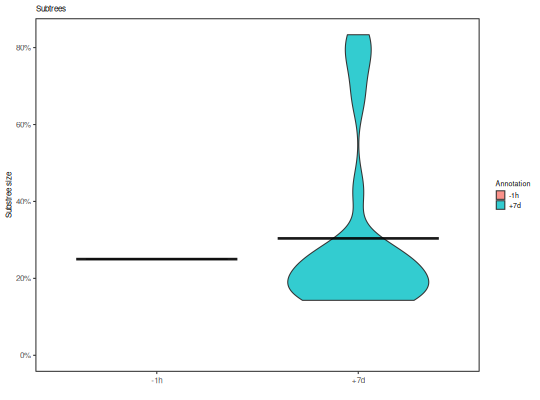
# Violin plots of subtree size by sample
plotSubtrees(graphs, "sample_id", "size", style="v")
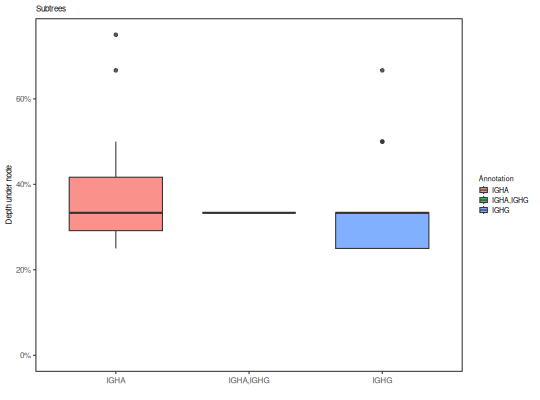
# Boxplot of node depth by isotype
plotSubtrees(graphs, "c_call", "depth", style="b")
See also
Subtree statistics are calculated with summarizeSubtrees.