plotEdgeTest - Plot the results of an edge permutation test
Description
plotEdgeTest plots the results of an edge permutation test performed with
testEdges as either a histogram or cumulative distribution function.
Usage
plotEdgeTest(
data,
color = "black",
main_title = "Edge Test",
style = c("histogram", "cdf"),
silent = FALSE,
...
)
Arguments
- data
- EdgeTest object returned by testEdges.
- color
- color of the histogram or lines.
- main_title
- string specifying the plot title.
- style
- type of plot to draw. One of:
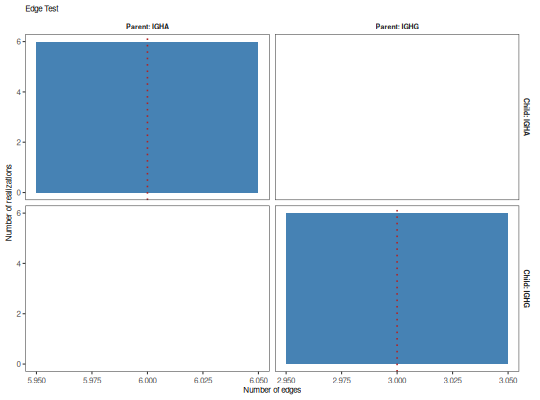
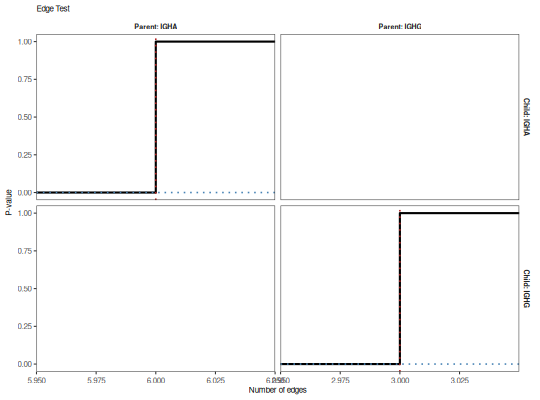
"histogram": histogram of the edge count distribution with a red dotted line denoting the observed value."cdf": cumulative distribution function of edge counts with a red dotted line denoting the observed value and a blue dotted line indicating the p-value.
- silent
- if
TRUEdo not draw the plot and just return the ggplot2 object; ifFALSEdraw the plot. - …
- additional arguments to pass to ggplot2::theme.
Value
A ggplot object defining the plot.
Examples
# Define example tree set
graphs <- ExampleTrees[6:10]

# Perform edge test on isotypes
x <- testEdges(graphs, "c_call", nperm=6)

# Plot
plotEdgeTest(x, color="steelblue", style="hist")
plotEdgeTest(x, style="cdf")
See also
See testEdges for performing the test.