plotDiversityCurve - Plot the results of alphaDiversity
Description
plotDiversityCurve plots a DiversityCurve object.
Usage
plotDiversityCurve(
data,
colors = NULL,
main_title = "Diversity",
legend_title = "Group",
log_x = FALSE,
log_y = FALSE,
xlim = NULL,
ylim = NULL,
annotate = c("none", "depth"),
score = c("diversity", "evenness"),
silent = FALSE,
...
)
Arguments
- data
- DiversityCurve object returned by alphaDiversity.
- colors
- named character vector whose names are values in the
groupcolumn of thedataslot ofdata, and whose values are colors to assign to those group names. - main_title
- string specifying the plot title.
- legend_title
- string specifying the legend title.
- log_x
- if
TRUEthen plotqon a log scale; ifFALSEplot on a linear scale. - log_y
- if
TRUEthen plot the diversity/evenness scores on a log scale; ifFALSEplot on a linear scale. - xlim
- numeric vector of two values specifying the
c(lower, upper)x-axis limits. - ylim
- numeric vector of two values specifying the
c(lower, upper)y-axis limits. - annotate
- string defining whether to added values to the group labels
of the legend. When
"none"(default) is specified no annotations are added. Specifying ("depth") adds sequence counts to the labels. - score
- one of
"diversity"or"evenness"specifying which score to plot on the y-asis. - silent
- if
TRUEdo not draw the plot and just return the ggplot2 object; ifFALSEdraw the plot. - …
- additional arguments to pass to ggplot2::theme.
Value
A ggplot object defining the plot.
Examples
# Calculate diversity
div <- alphaDiversity(ExampleDb, group="sample_id", nboot=100)
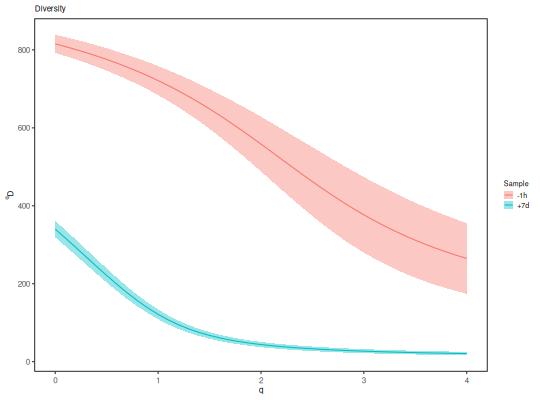
# Plot diversity
plotDiversityCurve(div, legend_title="Sample")
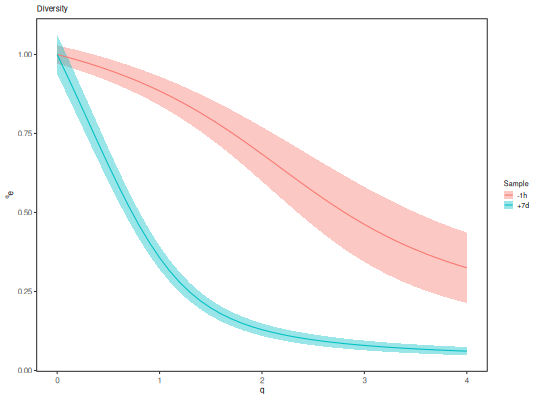
# Plot diversity
plotDiversityCurve(div, legend_title="Sample", score="evenness")
See also
See alphaDiversity and alphaDiversity for generating DiversityCurve objects for input. Plotting is performed with ggplot.